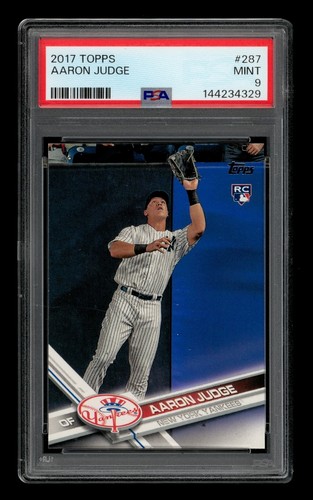
Aaron Judge
Aaron Judge 2017 Topps #287
•#287
Grade:
Showing all grades mixed together — this blends different variants and should not be read as one specific grade's market value.
Last Sale
$59
Estimated Value
$146.8
30-Day Outlook
$73.4 – $220.2
Expected Move
+148.8%
Watch
High Confidence
Signals are mixed right now — worth watching before drawing a conclusion.
Why this signal
Estimated Value. Trading 40.4% below CardEdge's estimated value.
Price Trend. Recent prices have been trending lower.
Prediction Support. CardEdge's prediction signals are currently mixed.
Sales Activity. This card is trading regularly.
Price Stability. Recent sale prices have varied significantly.
Price History
Aggregated by day/week/month depending on span, plus outlook if available (dashed)
156 sales shown for all recorded history.
Recent Sales
Most recent confirmed sold comps
| Date | Price | Grade | Original Sale |
|---|---|---|---|
2026-11-01 2d ago | $59 | PSA 8 | View on eBay |
2026-11-01 2d ago | $215.99 | SGC 8 | View on eBay |
2026-11-01 2d ago | $71 | PSA 9 | View on eBay |
2026-11-01 2d ago | $89 | PSA 9 | View on eBay |
2026-11-01 2d ago | $72 | PSA 9 | View on eBay |
2026-11-01 2d ago | $65 $46 Offer accepted | PSA 7 | View on eBay |
2026-11-01 2d ago | $299.99 | PSA 10 | View on eBay |
2026-11-01 2d ago | $170 | PSA 8 | View on eBay |
Price Distribution




Card Details
Year2017
BrandTopps
Set—
Card Number287
Parallel—
7D Change
+16.7%
30D Change
-10.6%
90D Change
-1.4%
Sale Range
$10.5–$2,500
CardEdge Market Score
62Score
CardEdge Market Score
Moderate Confidence
Weighted composite of price momentum, sales activity, liquidity, price stability, and data confidence from real sold-comp data — not a black-box prediction.
Factor Breakdown
Price Trend39
Sales Activity100
Market Activity93
Price Stability0
Data Quality75
Total Score62 / 100
Price Stability (volatility)116%
Sales Activity18/7d · 156 total
Last sale vs. estimated value-59.8%
Data Qualityhigh (75/100)
History Coverage245d, 156 sales
Prediction methods
Market modelBearish
Pattern model (ML)Bullish
Pattern model track record84% direction accuracy (30D, historical testing)
Track record reflects accuracy on past held-out data — not the odds of any single prediction being correct.
156 sales analyzed across all grades (recency-weighted fair value) — filter by grade for a more precise outlook.
Price volatility: 116% of median.
Sales velocity +29.8% vs. the prior 30 days.
10.6% decrease over the last 30 days vs. prior sales.
24 unusually priced sales excluded from this outlook.