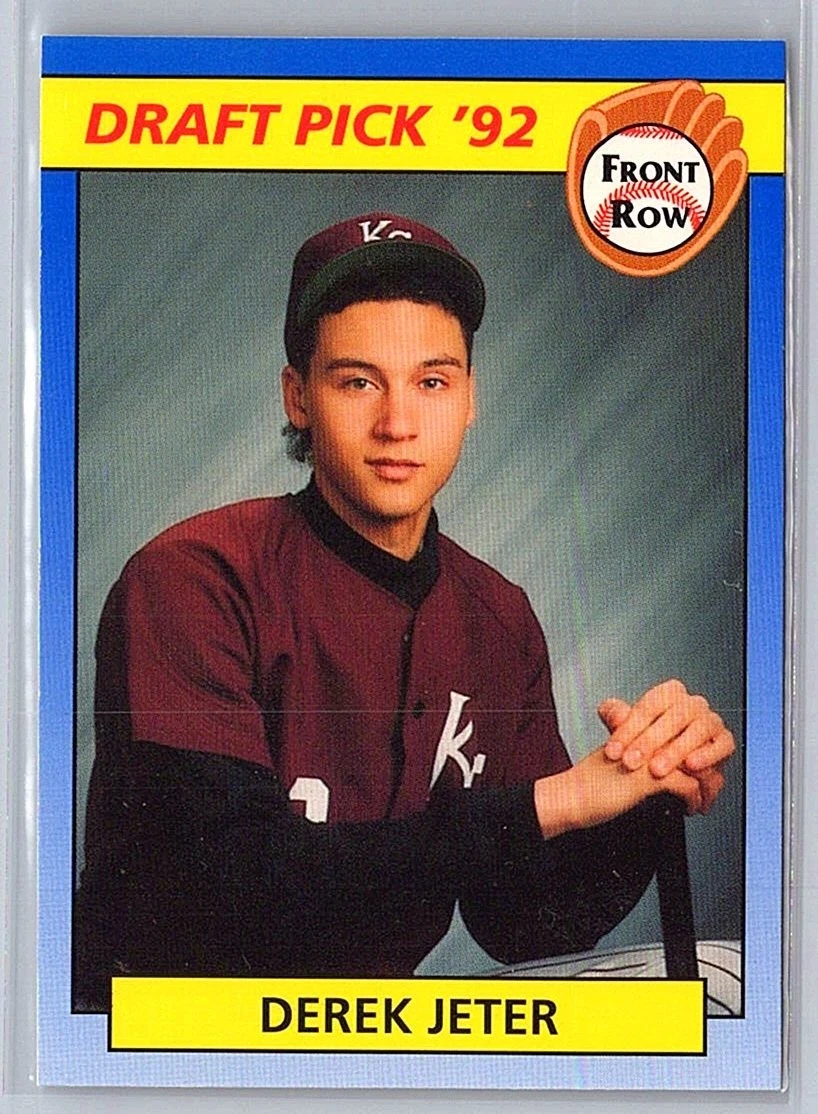
Derek Jeter
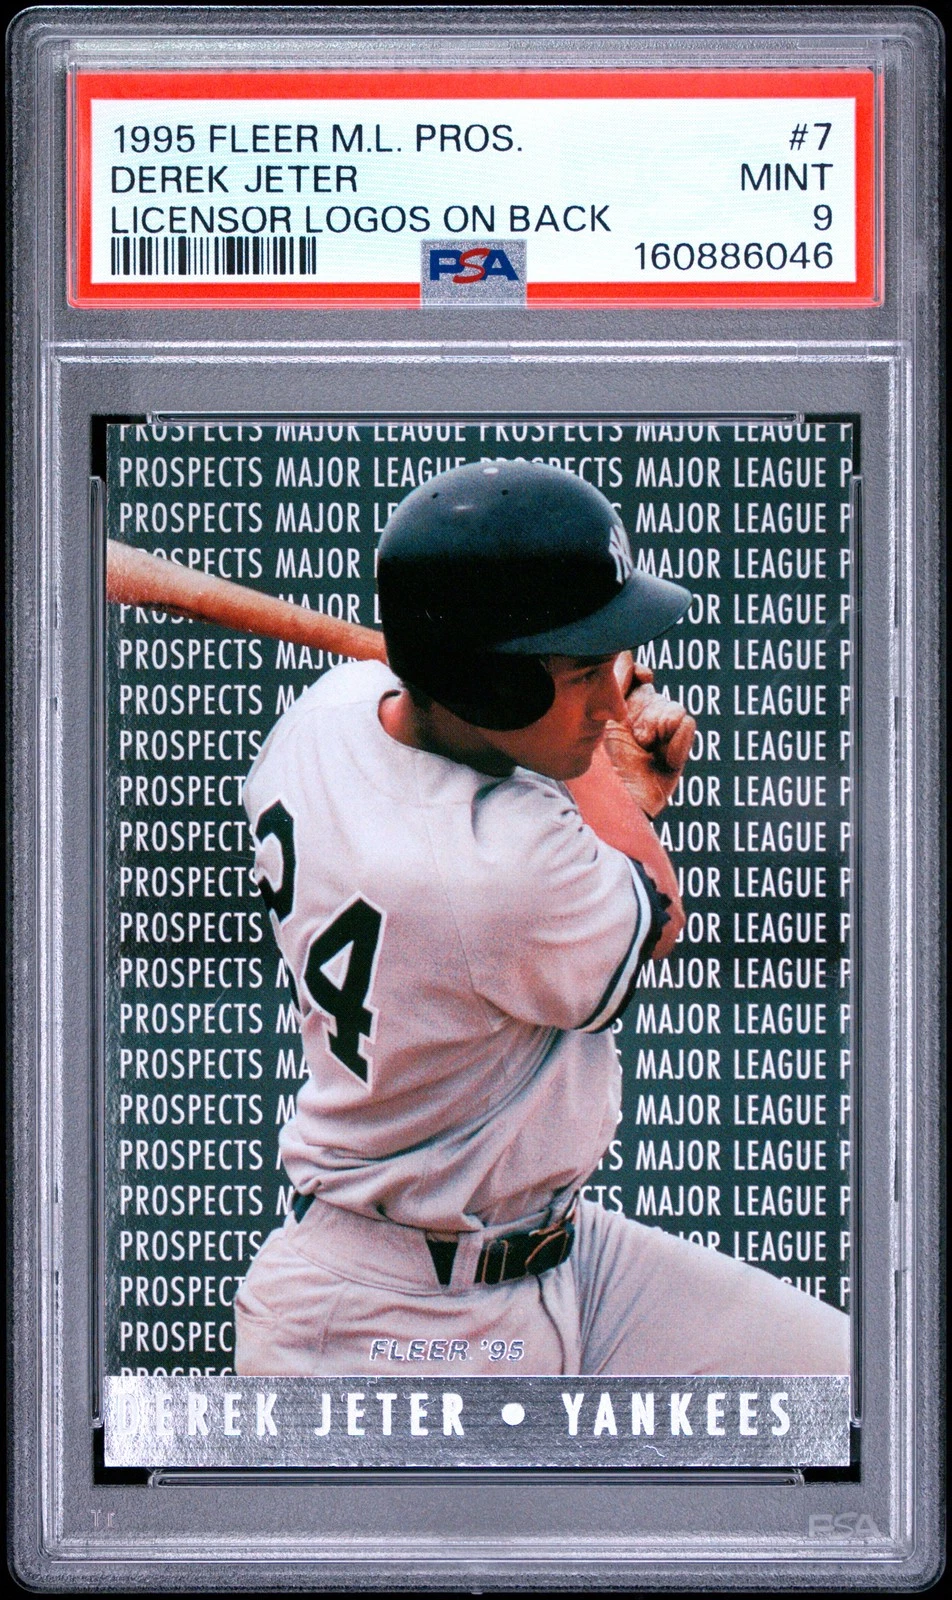
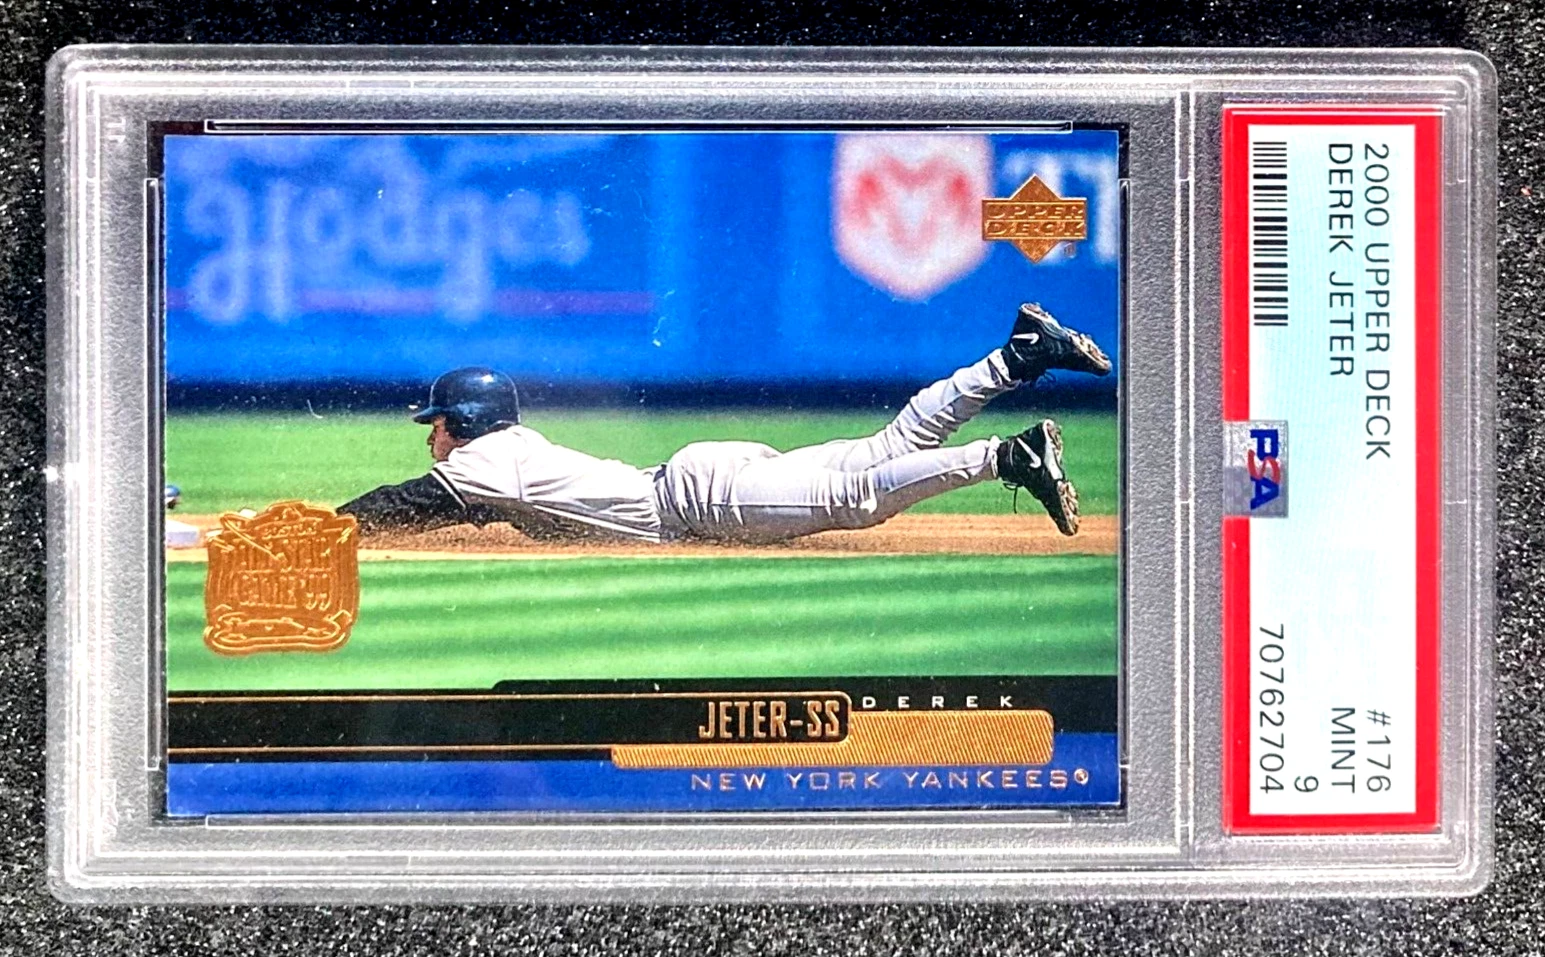
Derek Jeter 1992 #55
•#55
Grade:
Showing all grades mixed together — this blends different variants and should not be read as one specific grade's market value.
Last Sale
$220
Estimated Value
$29.09
30-Day Outlook
$17.8 – $40.38
Expected Move
-86.8%
Caution
Medium Confidence
Trading 656.3% above CardEdge's estimated value.
Why this signal
Estimated Value. Trading 656.3% above CardEdge's estimated value.
Price Trend. Recent prices have been trending lower.
Price History
Aggregated by day/week/month depending on span, plus outlook if available (dashed)
44 sales shown for all recorded history.
Recent Sales
Most recent confirmed sold comps
| Date | Price | Grade | Original Sale |
|---|---|---|---|
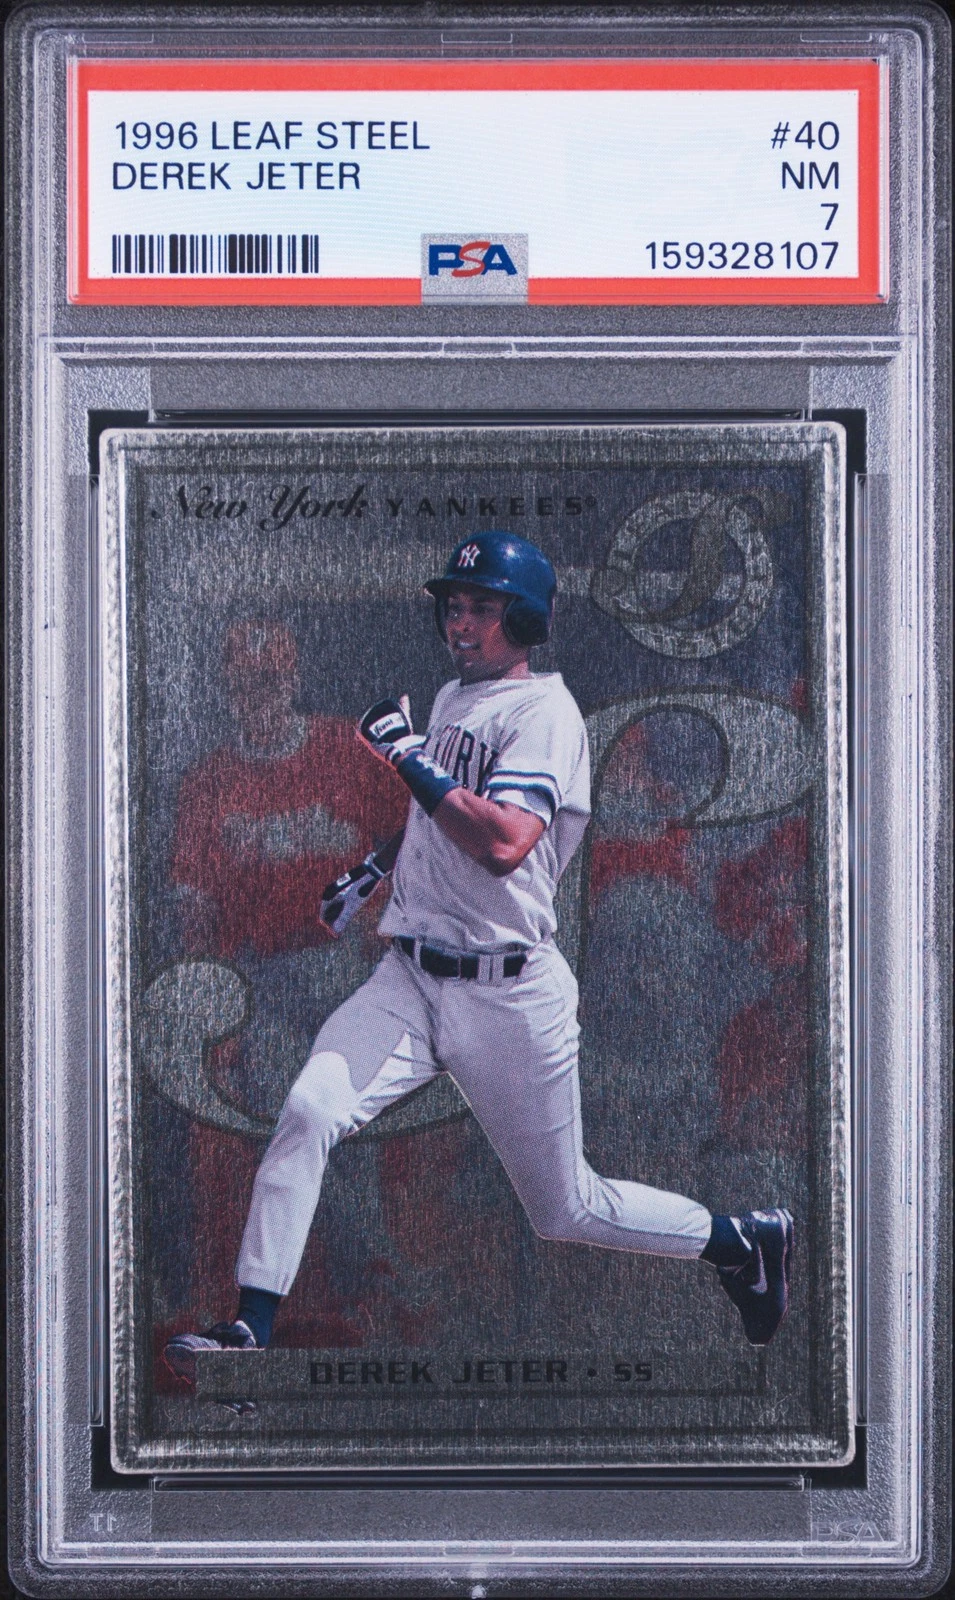
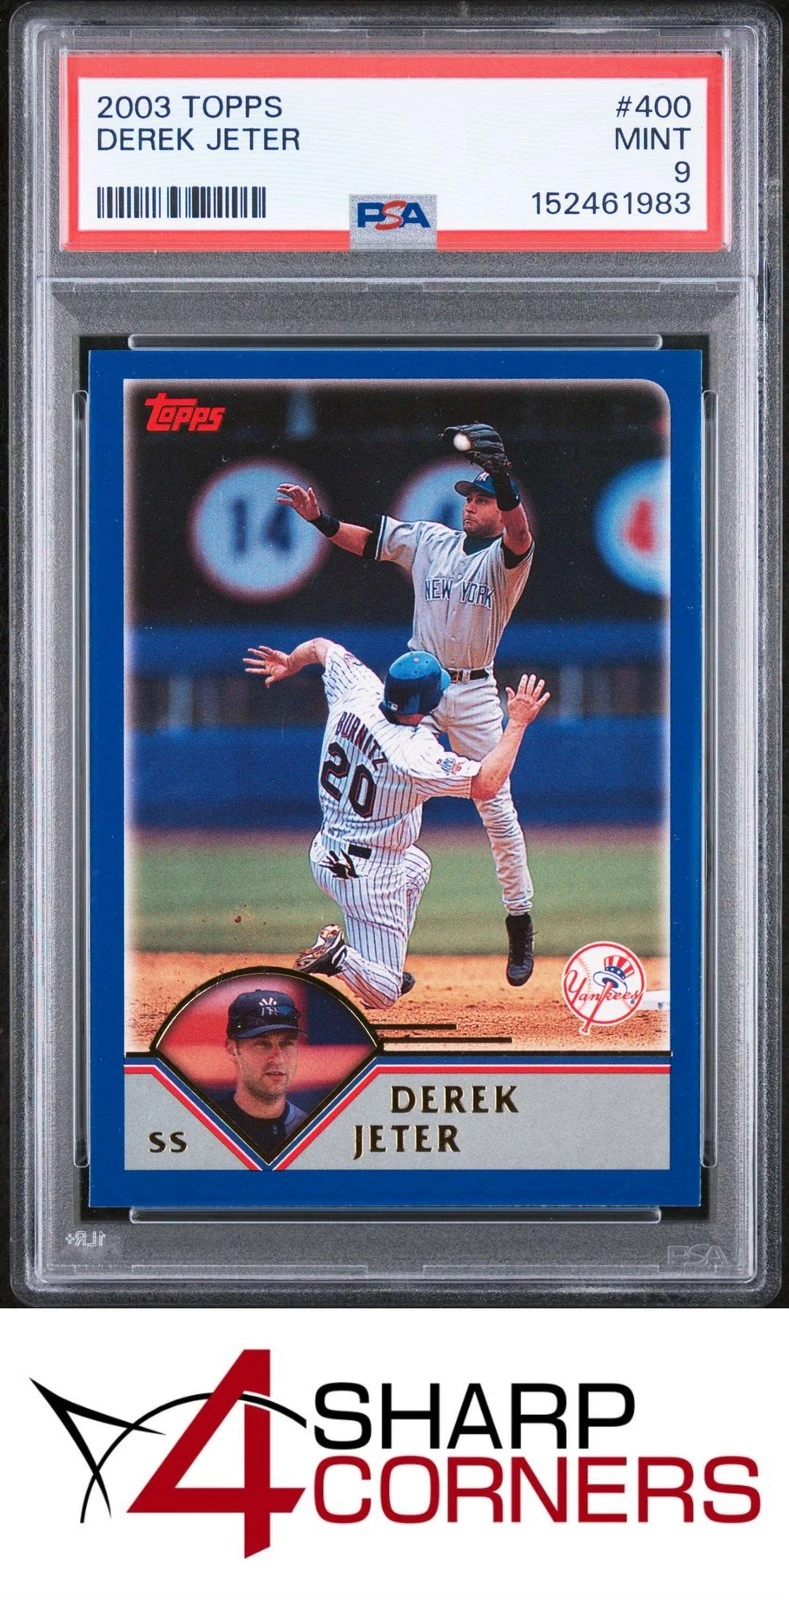
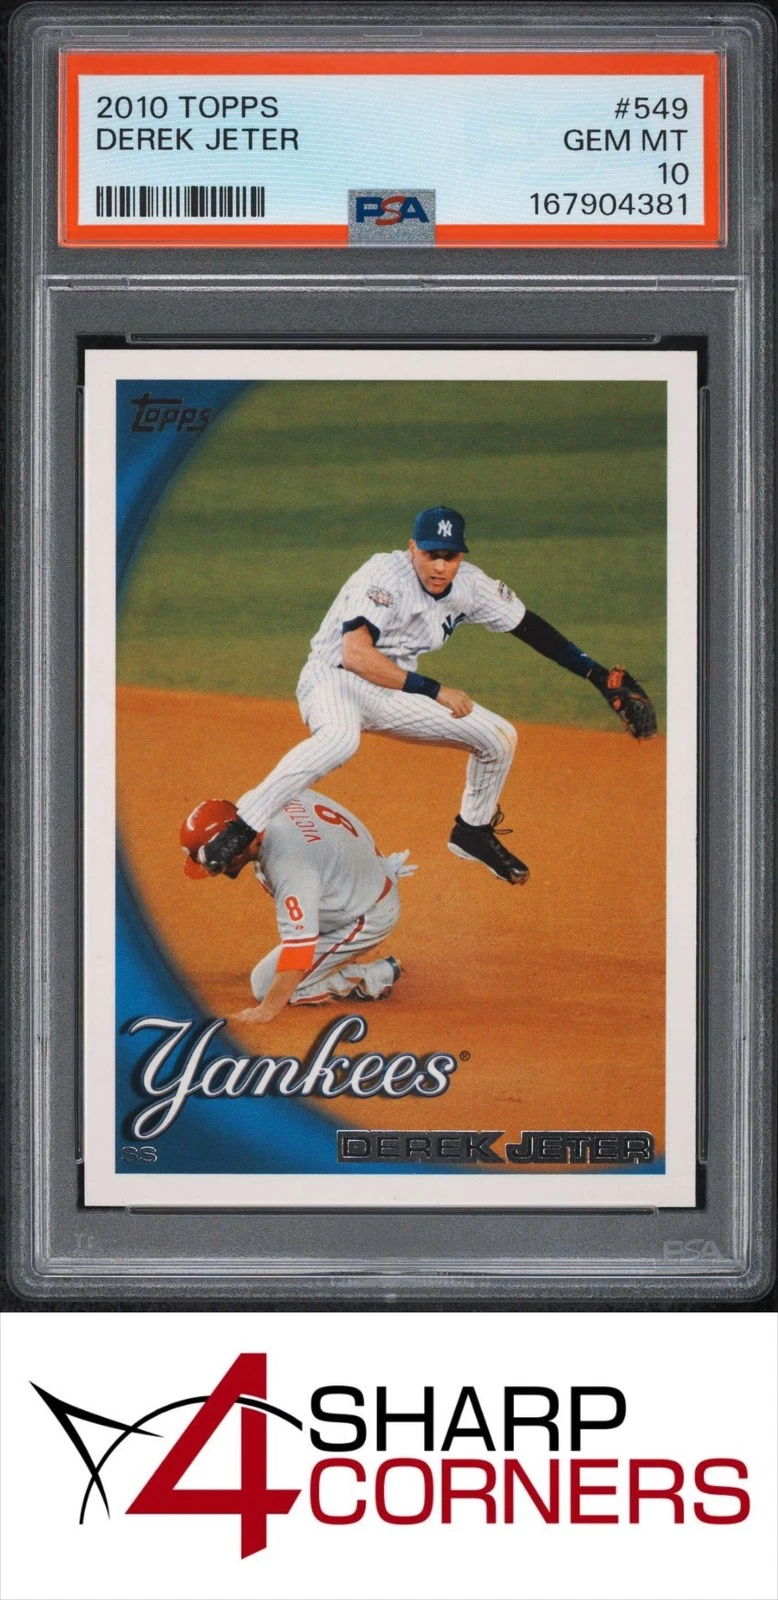
2026-11-02 2d ago | $220 | PSA 8 | View on eBay |
2026-10-27 8d ago | $1,000 $550 Offer accepted | PSA 7 | View on eBay |
2026-10-27 8d ago | $14.5 | PSA 8 | View on eBay |
2026-10-26 9d ago | $24.99 | PSA 9 | View on eBay |
2026-10-20 15d ago | $41 | PSA 8 | View on eBay |
2026-10-20 15d ago | $27 $18 Offer accepted | PSA 9 | View on eBay |
2026-10-19 16d ago | $275 | PSA 10 | View on eBay |
2026-10-19 16d ago | $2.36 | SGC 8 | View on eBay |
Price Distribution

Card Details
Year1992
Brand—
Set—
Card Number55
Parallel—
7D Change
-19.4%
30D Change
-7.1%
90D Change
+43.6%
Sale Range
$2.36–$1,350
CardEdge Market Score
50Score
CardEdge Market Score
Watchlist / Mixed
Weighted composite of price momentum, sales activity, liquidity, price stability, and data confidence from real sold-comp data — not a black-box prediction.
Factor Breakdown
Price Trend45
Sales Activity35
Market Activity57
Price Stability61
Data Quality61
Total Score50 / 100
Price Stability (volatility)39%
Sales Activity0/7d · 44 total
Last sale vs. estimated value+656.3%
Data Qualitymedium (61/100)
History Coverage89d, 44 sales
Prediction methods
Market modelBearish
Pattern model (ML)Not yet reliable
Track record reflects accuracy on past held-out data — not the odds of any single prediction being correct.
44 sales analyzed across all grades (recency-weighted fair value) — filter by grade for a more precise outlook.
Price volatility: 39% of median.
Sales velocity -12.5% vs. the prior 30 days.
7.1% decrease over the last 30 days vs. prior sales.
12 unusually priced sales excluded from this outlook.